GNN Model
By exploratory data analysis, we found the crime was related to the victim, time and space. While producing the most precisely individual level analysis has high computation, it is relative fast and accurate for group/class analysis. Therefore, we intend to do a group analysis of crime and these independent variables. The data can be considered as a graph naturally, which represents the relations (crime) between entities (times and victims at different certain spaces). In addition, because the data graph was permutation invariant, we used graph neural networks (GNN) to solve this link prediction task.
Methodology
Graph neural networks can extract features and make predictions about entities and relations with more information. The reader is redirected to [1] for more details. An end-to-end trainable graph auto-encoder (GAE) has shown a significantly improvement in graph-structured data for link prediction on undirected graphs [2,3]. In what follows, we implement and evaluate graph auto-encoder on our dataset.
Experiments
Data Processing
Data sources have been mentioned earlier. In terms of time, we considered variables of date and time for events. Age, race and sex were selected as variables of victims. In the degree of space, we used service of subway lines and cluster of neighborhoods mentioned before. Considering the computing cost, we grouped subway crime data from 2006 to 2021, as shown in table. In order to transform our data into GNN acceptable, we set different (date, time) pair as item nodes and different (age, race, sex, service, cluster) vector as user nodes, and link prediction task appeared between user and item nodes. Finally, there were 1612 user nodes, 2196 item nodes and 28126 edges between them.
| date | 366 days of the year |
| time | 6 time intervals with a length of 4 hours |
| age | 5 age groups by raw data |
| race | 6 race groups by raw data |
| sex | male and female |
| service | 8 service groups obtained by previous section |
| cluster | 8 cluster groups obtained by previous section |
Model selection
The data set were divided by training set, validation set (with negative sampling) and testing set (with negative sampling) with ratio 0.6, 0.2 and 0.2, respectively. After adjusting the super parameters to get better results in the validation set, we utilized two layers graph convolution neural networks and 0.5 dropout between them as encoder, which could add noise between layers to enhance the robustness of the model. The inner product was considered as the decoder. The learning rate was selected as 0.006 by validation set. After choosing binary cross entropy loss as loss function, the model has been basically established.
Results
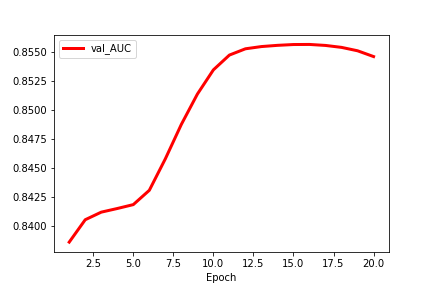
The AUC was utilized to evaluate this model. As shown in plot, although there were a little bit overfitting at the end epoch, the AUC of GAE in validation set was 0.8539. It indicated the probability that the predicted positive case is ahead of the negative case is 0.8539. Finally, in the testing set the AUC was 0.8543, which showed GAE was a classifier with good effect (>0.85).
Application
In crime prediction task, we though highly of recall more than precision, because FN is more serious than FP and we wouldn’t take that risk. Therefore, we took threshold as 0.45 and predicted as positive (crime occurring) if outcome was greater than it.
Model Reproduction
See ‘README.txt’ file in github model folder.
Reference
[1] Daigavane, et al., “Understanding Convolutions on Graphs”, Distill, 2021.
[2] Thomas N. Kipf and Max Welling. 2016. Variational Graph Auto-Encoders. NIPS Bayesian Deep Learning Workshop (2016).
[3] Berg, Rianne van den, Thomas N. Kipf, and Max Welling. “Graph convolutional matrix completion.” arXiv preprint arXiv:1706.02263 (2017).